TraceMonkey does really well at lots of benchmarks. Specifically, it does well at benchmarks that it can trace compile. If for some reason a loop contains a code path that cannot be traced, that path will never run inside the JIT – instead it stays in the interpreter, which is much slower.
There isn’t much left that we can’t trace, but when that happens, it lights up benchmarks in bad ways. One of the areas we don’t trace at all is recursion.
Recursion isn’t too common on the web but it’s still a big hole in our functionality, so I worked on it quite a bit this summer. Unfortunately it’s non-trivial, and still hasn’t landed, but I’d like to talk about what I do have working.
Quick Introduction
TraceMonkey uses trace trees. If some repetitive code is run, like a loop, a trace recorder kicks in. This records the behavior of the code for one iteration. If any behavior could diverge at runtime – such as an if branch – it becomes a “guard”, and we only record the observed path.
We assemble these observations into statically-typed, native CPU code. If a guard is triggered while running this new, faster code, it means the behavior has changed. We start recording a new path, and attach it to the point of divergence. Thus the code is literally a tree of traces.
Recursion is a Loop, Sort Of
Recursion is a loop, so we’d like to compile as such, using the behavior we observe at runtime. Let’s look at a simple recursive function and identify where it loops.
Select All Code:function factorial(n) {
  if (n == 0)
    return 1;
return n * factorial(n - 1);
}
What happens when you call factorial(10)? It starts off in the interpreter here:
n isn’t 0, so the indented path gets skipped.
First n - 1 evaluates to 9. Then factorial() is called again, and we’re back at:
Bam. We’ve hit the same point, and thus identified a repeating pattern. To make sure it’s hot, the tracer recorder waits for one more iteration. Then it kicks in and starts recording the behavior it sees. Is (n == 0)? No, n is 8, so the tracer records:
Next, the trace compiler sees the n - 1 and function call and records those.
Select All Code:2: subtract(n, 0x1)
3: add stack space (frame) for factorial call
4: n = result of instruction #2
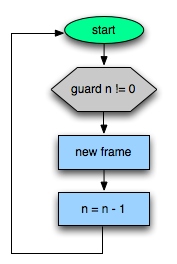
Next the trace recorder sees if n == 0, which is where it started recording. It adds a “jump to the beginning” instruction and compiles the trace to native code. Visually it looks something like this:

But wait! That’s only “half” of the function. Specifically, it’s the down-recursive half, which dives deeper and deeper. What happens when we run this? The code will build a bunch of stack frames that look like this:
| frame # |
variables |
| 9 |
n = 0 |
| 8 |
n = 1 |
| 7 |
n = 2 |
| 6 |
n = 3 |
| 5 |
n = 4 |
| 4 |
n = 5 |
| 3 |
n = 6 |
| 2 |
n = 7 |
| 1 |
n = 8 |
When n == 0, the guard fails. This is really nasty. It turns out the JIT and interpreter have completely different ways of representing stack frames, and when transferring control the frames must be converted from one to the other. Locally, this process is really expensive. As you can imagine it is disastrous for deeply recursive functions. The only way to fully mitigate this is to make sure we spend more time in the JIT. Ideally, we never want to reconstruct any frames.
Upwards Recursion
But back to what happens. n == 0, the guard has triggered, and we’re back in the interpreter. The recorder only wants to observe hot code, so it doesn’t record the path from the guard yet. Now we see this get executed:
Remember, we’re at frame #9 from the diagram above. The “return” instruction pops us to frame #8, and now we’re at:
Select All Code: return n * (result of factorial(n - 1));
This returns 1 * 1 to the calling function, and now we’re at:
Select All Code: return n * (result of factorial(n - 1));
We’re back at the same place! That’s a loop. This time 2 * 1 is multiplied to return 2. The trace recorder kicks in and starts recording from frame #6, but hits a snag: it sees a return, but hasn’t recorded a matching function call for this trace. This is where things get weird. How can it observe a return if it doesn’t know anything about frame #5?
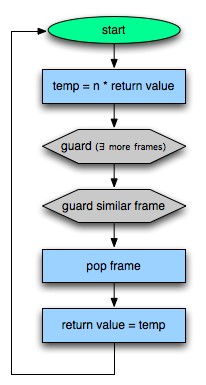
It can’t. That’s sad, but we really want to solve this. If the JIT can unwind its own recursive frames, we won’t hit that expensive synthesizing path. The trick is to infer some uniquely identifying information about frame 5: its variable’s types and program counter. We guard on that identity. If that guard fails at runtime, we know that it is illegal to keep popping frames.
The resulting trace looks like this:

Linking the Two Halves
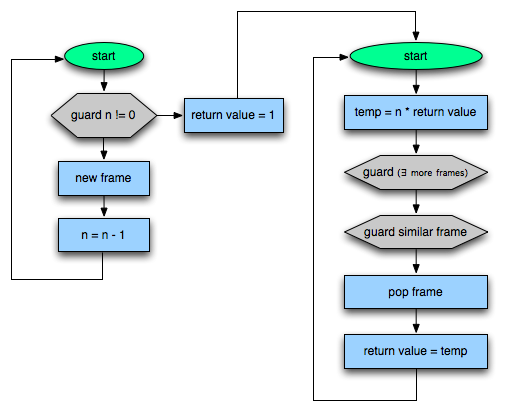
Hopefully, the down-recursive side will be run again. When the n == 0 guard hits, it will be “hot”, and the recorder starts up. This time it notices the “return”, looks at the above frame, and recognizes that recursion is unwinding. It links the two traces together like so:

Beautiful! Except for…
Next Time
There are still problems with this approach. The major one is that by the time the up-recursive frame is built, all of the frames exist on the interpreter – not the JIT. When control transfers from the interpreter to the JIT, only one frame is converted because the process is very expensive.
That means the first up-recursive guard will hit, since there are no more JIT frames. We’ll do the expensive reconstruction process on the same frame, transfer it back to the interpreter, then re-enter the interpreter. This will happen for each frame until the recursion is unwound, all to execute a few multiplies!
That’s REALLY bad. To make things worse, this whole process will happen at least twice. The first time is to unwind the initial down recursion. The next time is because the n == 0 guard fails, and all the frames are popped off the JIT and transferred to the interpreter again. Everything only runs smoothly on the third invocation of the recursion function.
Next time I’ll discuss approaches to solving that situation.

![]()
